Duration: 90 minutesModule: WritingFocus: Task 1 format, the 4-part structure, paraphrasing the prompt, writing strong overviews
Objectives
Understand exactly what Academic Task 1 asks — and what it forbids (no opinions, no guessing reasons).
Learn the four-part structure: Introduction → Overview → Body 1 → Body 2.
Paraphrase the question prompt confidently so you never copy it word-for-word.
Spot the two or three biggest features for a strong overview — the part that decides your band most.
Build a bank of trend and comparison language and use it accurately.
How today is paced
Six blocks fill 90 minutes, ending in a timed write. If we move fast, an Extension Bank at the bottom has a second data set and a sentence-building drill.
0:00 – 0:10
Warm-Up: What Task 1 Really Asks
Academic Task 1 gives you a chart, graph, table, map, or process. Your job is to describe and summarise the information — like a news reporter, not a columnist. You report what the data shows. You do not give your opinion, and you do not explain why something happened.
Allowed or not allowed?
Tick ✓ if the sentence belongs in a Task 1 report, ✗ if it breaks the rules.
"Sales of coffee rose steadily between 2010 and 2020."
"In my opinion, this trend is very positive."
"The figure for tea was the highest, at 60%."
"Sales probably fell because of the bad economy."
"Overall, all three categories increased over the period."
✓ — describes a trend with data. Perfect.
✗ — opinion. Never write "in my opinion" in Task 1.
✓ — reports a specific figure. Good.
✗ — "probably… because" guesses a reason. The chart doesn't tell you why.
✓ — a summary statement, ideal for the overview.
The rule in one line: report the data, summarise the data, compare the data. Nothing else.
0:10 – 0:25
The Anatomy of a Task 1 Answer
Every strong Task 1 response has the same four parts. Learn the skeleton once and reuse it for every chart you ever see.
Paragraph
Job
How many sentences
1. Introduction
Paraphrase the question — say what the chart shows
1
2. Overview
State the 2–3 biggest features. No specific numbers here.
2
3. Body 1
Describe one group of details with figures
2–3
4. Body 2
Describe the rest of the details with figures
2–3
The numbers that govern Task 1
150 words minimum — under this, you lose marks automatically. Aim for 160–190.
20 minutes — Task 1 is worth one-third of your Writing score; Task 2 is two-thirds, so don't overrun.
Four marking criteria: Task Achievement (did you cover it?), Coherence & Cohesion (is it organised?), Lexical Resource (vocabulary), Grammatical Range & Accuracy.
Label the parts
Here is a complete short report, jumbled. Write which part each sentence is: Introduction · Overview · Body.
"The two highest figures were both recorded in 2020, while 2010 saw the lowest across every category." →
"The chart shows the number of visitors to three museums in London between 2010 and 2020." →
"The British Museum received 5.6 million visitors in 2010, rising to 6.8 million by 2020." →
Overview — biggest-picture features, no precise single figures driving it.
Introduction — paraphrases what the chart shows.
Body — specific figures for one item.
Correct order in a report: 2 → 1 → 3. Introduction first, then overview, then bodies.
0:25 – 0:40
The Introduction: Paraphrase the Prompt
Your first sentence must rewrite the question in your own words. Never copy the prompt — copied words don't count toward your 150 and signal weak vocabulary. Swap the verb, swap the nouns, keep the meaning.
The swap bank
shows → illustrates, presents, gives information about, compares
the number of → the figures for, the quantity of
from 2010 to 2020 → over a ten-year period, between 2010 and 2020
graph / chart → bar chart, line graph, table, diagram (name the real one)
Rewrite the prompt
Original prompt: "The chart below shows the amount of money spent on fast food in the UK from 2000 to 2010." Write two different paraphrases.
"The bar chart illustrates how much money was spent on fast food in the UK over an eleven-year period."
"The graph gives information about UK expenditure on fast food between 2000 and 2010."
Notice: verb changed (shows → illustrates / gives information about), "amount of money" → "expenditure," and the dates were reworded. No phrase copied whole.
0:40 – 0:55
The Overview: The Sentence That Decides Your Band
Examiners look for a clear overview first. It states the two or three biggest features — the overall trend, the highest and lowest, or the largest change. No exact numbers go in the overview; numbers belong in the body. Start it with Overall, or In general,.
Data — Weekly hours spent online by age group (%)
Age group
2005
2015
16–24
18
34
25–44
12
28
45–64
6
19
65+
2
9
Spot the big features
Before writing, answer these — they become your overview.
What happened to every group over the period?
Which group was always highest?
Which group was always lowest?
Every age group increased its time online.
The 16–24 group was highest throughout.
The 65+ group was lowest throughout.
Model overview: "Overall, the proportion of time spent online rose across all age groups, with the youngest group consistently the highest and the oldest the lowest." — Two big features, no exact figures. Band 7 material.
0:55 – 1:10
Trend & Comparison Language Bank
Variety of accurate language lifts your Lexical Resource and Grammar marks. Tap each term to see how to use it.
rise / increase / climb (verbs)
"Sales rose sharply." Pair with an adverb: sharply, steadily, gradually, dramatically.
a rise / an increase (nouns)
"There was a sharp rise in sales." Pair with an adjective + noun: a steady increase, a dramatic rise.
fall / decline / drop / decrease
"Figures declined gradually." Or noun form: "a gradual decline."
peak (at) / reach a peak
"Numbers peaked at 80% in 2018." The highest point of a line.
plateau / remain stable / level off
"Figures levelled off after 2015." No real change — a flat line.
fluctuate
"Prices fluctuated between 2000 and 2010." Up and down irregularly.
comparison: higher / twice as high / the highest
"X was twice as high as Y." / "Z recorded the highest figure."
Gap-fill — choose the right form
There was a sharp ______ in unemployment. (rise / rose)
Tourist numbers ______ steadily until 2010. (a rise / rose)
Sales ______ at 90% before falling. (peaked / a peak)
The figure for tea was ______ as high as the figure for coffee. (twice / two)
rise (noun, after "a sharp")
rose (verb)
peaked (verb)
twice ("twice as high as")
The classic error is mixing noun and verb forms ("a sales rose"). Decide first: am I writing a verb sentence or a noun sentence?
1:10 – 1:30
Practice: Write an Introduction + Overview
Use the "weekly hours online" table from the language block above. Write one introduction sentence (paraphrase the prompt) and a two-sentence overview (biggest features, no exact numbers). Target 50+ words. 12 minutes.
Prompt to paraphrase
"The table shows the percentage of free time that four age groups in one country spent online in 2005 and 2015."
Write a two-sentence overview. Then reveal a model.
"Overall, smartphone and computer ownership rose substantially over the two decades, with smartphones showing by far the largest growth, whereas television ownership remained almost unchanged at a high level."
Extra 2 — Sentence combining
Join each pair into one Band-7 sentence using "while," "whereas," or "compared with."
Computer ownership rose to 88%. Television ownership stayed near 95%.
Smartphones reached 92% in 2020. They were owned by only 2% in 2000.
"Computer ownership climbed to 88%, whereas television ownership remained steady at around 95%."
"Smartphone ownership reached 92% in 2020, compared with just 2% in 2000."
Reference
The Four Task 1 Visuals — and How They Differ
Academic Task 1 always gives you a visual to describe, and it will be one of four kinds. The skill — and the language — changes with each, so learn to recognise them on sight.
Graph / chart
Numbers that change over time, or a comparison between groups — line graph, bar chart, pie chart.
Language: rose, fell, peaked, the highest, compared with, twice as many.
Table
Exact figures in rows and columns. Often paired with a graph.
Language: the figure for X stood at, exactly, accounted for.
Map / plan
How a place changed over time, or two locations compared. No numbers — describe position and change.
Language: was relocated to, a new X was built, was demolished, to the north of (passive + location).
Process / diagram
The stages of how something is made or how a cycle works. Describe the steps in order.
Language: first, next, after that, the X is then…, the cycle repeats (sequencers + passive).
You'll spend most of this course on graphs and charts — the most common type — but you must be ready for all four. Compare a graph, a map, and a process below, and notice how differently you'd have to write about each.
Graph + tableGraph/table task — describe the trends and the biggest differences; never list every number.Map / planMap task — describe what changed between the two years: what was built, removed, or replaced, and where.ProcessProcess task — describe the stages in order, usually in the passive voice (“the paper is collected… it is then mixed…”).Last 25 min
End-of-Class Task 1 — Timed + Instant AI Feedback
Put it together on a real chart. Write a full Task 1 answer (150+ words) in 20 minutes, then click Get AI Evaluation for an instant read on all four criteria — including Task Achievement — and Submit by email so your teacher can confirm the data accuracy against the chart and give fuller comments.
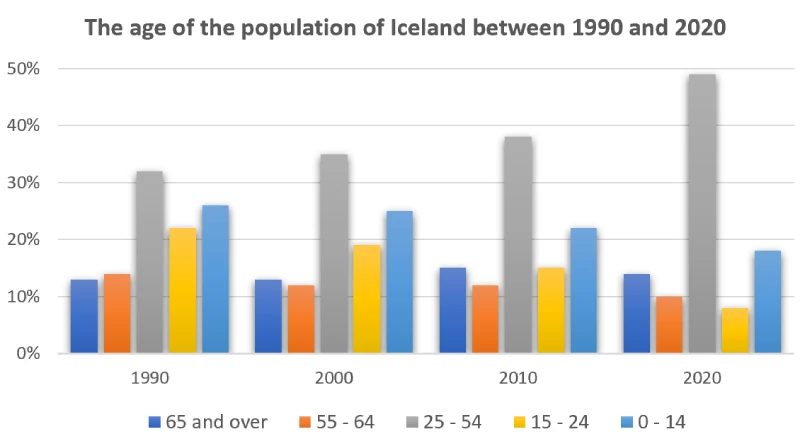
Bar chartThe chart shows the age of the population of Iceland between 1990 and 2020.
Task 1 prompt
The chart below shows the age of the population of Iceland between 1990 and 2020. Summarise the information by selecting and reporting the main features, and make comparisons where relevant. Write at least 150 words.
One-line recap: what are the four parts of a Task 1 answer, and which one decides your band most?
Tonight's homework
Write a full introduction + overview for the "Households owning a device" table in the Extension Bank, then add one body paragraph with figures. Submit by email from the homework page. 30 minutes.
That's the end of your free Day 1. Every day in the Full Class works exactly like this — timed handouts, instant answer keys, and homework with personal feedback. Tomorrow (Tuesday) the class continues with Writing Day 2 — Trends & Comparisons, and the week builds all the way to a full mock test under exam conditions.